
Your kitchen just got smarter.
We’re excited to introduce Reporting Filters & Visuals, a fresh new way to explore your metrics, spot trends, and understand what’s really happening in your kitchen, all inside The Food Corridor, without the spreadsheets and guesswork.
These new tools make your data easier to digest, faster to navigate, and way more fun to use. Whether you’re prepping next month’s board report, checking in on a single client, or planning for growth, the data you need is now right at your fingertips.
What’s New in Reporting
New Filters
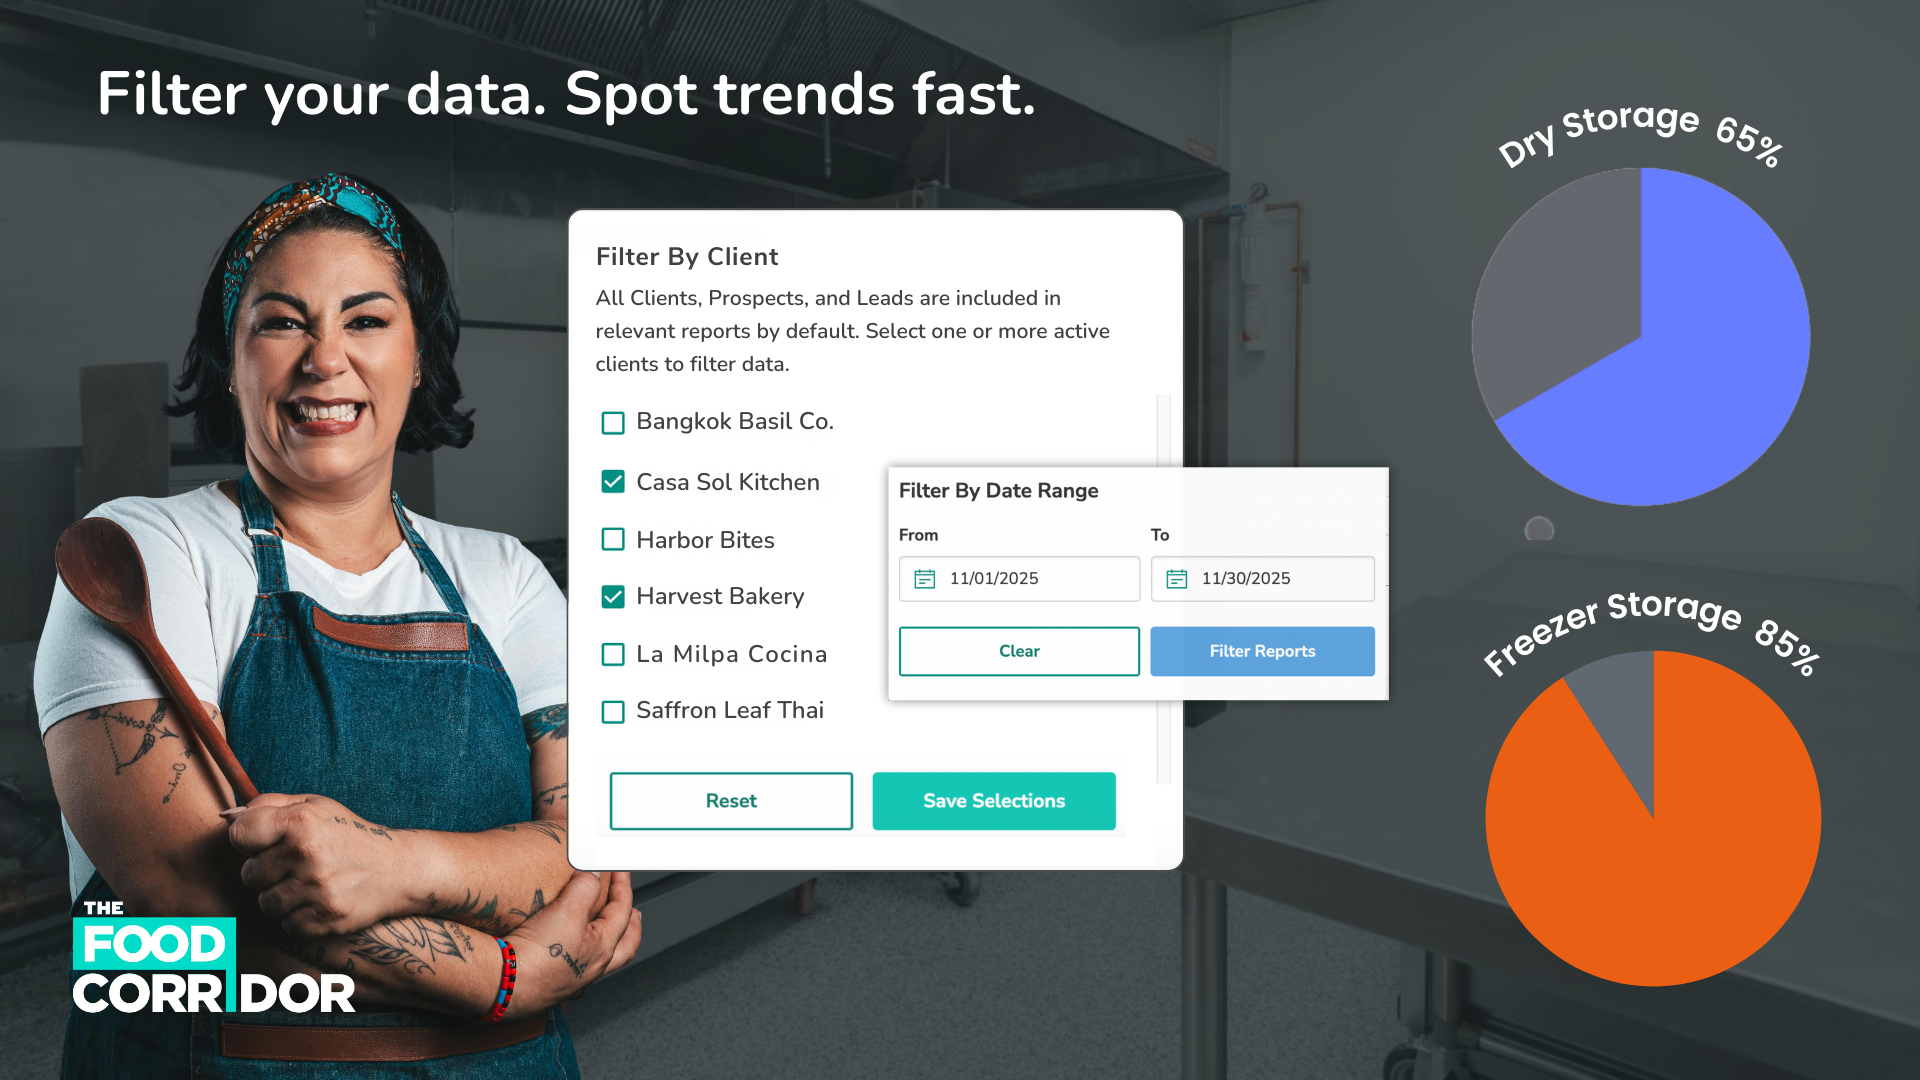
Your data. Your way.
Dive straight to the insights that matter most, without scrolling, sifting, or exporting.
Filter by Client
Curious how a member is performing? Want to compare across two businesses? Now you can. Compare “Beans and Brews” with “Cookie Crumble” to see who booked more hours, spent more, or grew the fastest last quarter.
Filter by Date Range
Track any timeline up to three years. From last week’s bookings to long-term revenue trends.
Example: View year-over-year growth or analyze last month’s bookings before your next team meeting (see below).

New Charts
Numbers are great. Charts and graphs are better.
These new visualizations make it easy to see patterns and take action. No spreadsheet gymnastics required.
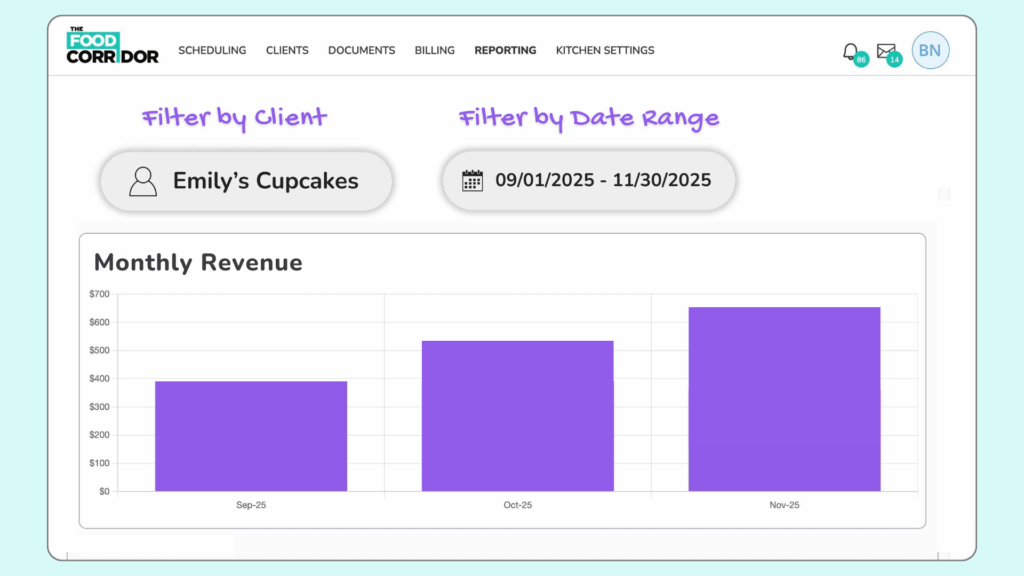
1. Monthly Revenue Over Time
See the rhythm of your revenue month by month. Spot peaks, dips, and growth patterns in seconds.
Example:
If October revenue drops, filter by client to find out who slowed down (see below), or compare last year’s graph to plan your next promo push.
2. Booking Hours Over Time
Understand exactly how your kitchen is being used and when demand is highest.
Example:
Identify your busiest and slowest months and use that data (see below) to adjust rental rates, promote off peak hours, or plan equipment investments.

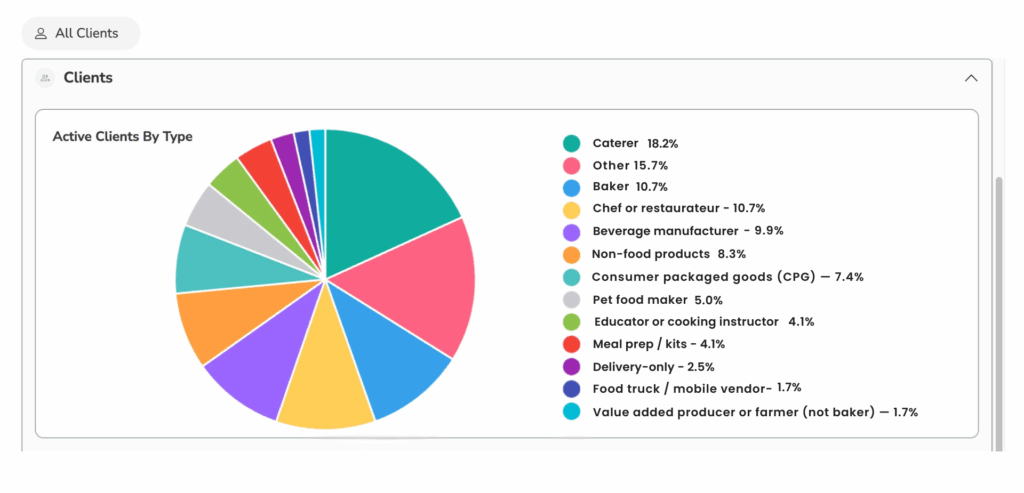
3. Active Clients by Type
See who is cooking in your kitchen with a clean breakdown of business types: bakers, caterers, food trucks, meal prep, CPG, and more.
Example:
If almost 40% of your members are caterers, bakers, and restauranteurs and only 1.7% are food trucks (see below), you can tailor marketing, plan equipment choices accordingly, or highlight business diversity in grant applications.
4. Storage Utilization by Type
Track how your dry, cold, freezer, and “other” storage is being used, and whether it’s being paid for.
Example:
If freezer space is nearly full but only a few members are paying for it, that is a hidden revenue leak, and now it is easy to catch (see below).
Why It Matters
Running a shared kitchen isn’t just about scheduling and cleaning and compliance (though you’re a hero for doing all that too). It’s about making smart decisions that help your businesses grow and help your kitchen thrive.
With these new filters and charts, you can:
- 🤓 See your most important numbers at a glance
- 📊 Uncover trends you may have missed
- 🕵️♀️ Spot where you’re losing money (and where you aren’t!)
- 💡 Make informed decisions in minutes, not hours
- 🫂 Support your members with clearer data
- 💁♀️ Feel more confident walking into meetings, calls, or planning sessions
In other words:
No more long spreadsheets. Just insights you can act on.
🚀 Try It Today
Head to your Reporting page to explore your new filters and charts.
See your kitchen’s data in full color, uncover what’s working, and make confident choices for your business.
👉 [Go to Reporting]